Tuesday, December 29, 2009
Are you a contrarian?
Interesting reading at ISEE index which shows a highly bearish sentiment among option traders. IN general market tend to fade this extreme sentiment. Are you prepared ?


Saturday, December 26, 2009
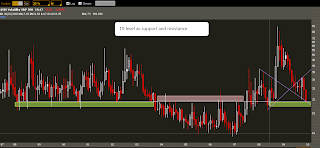
Possible pattern for VIX
As we may see, 19 level has been important support-resistance in the past.

Now we are looking for a possible definition of the cone expansion pattern (megaphone) we are showing here. Check the chart for a similar pattern before October 2008 breakout. In that case it was a contraction cone but the twin apparence, plus the coinciding level (19 area) make me think of a possible bounce off of it.

Let's keep an eye on it for a definition.

Now we are looking for a possible definition of the cone expansion pattern (megaphone) we are showing here. Check the chart for a similar pattern before October 2008 breakout. In that case it was a contraction cone but the twin apparence, plus the coinciding level (19 area) make me think of a possible bounce off of it.

Let's keep an eye on it for a definition.
Intriguing divergence
On Thursday closing I was looking at this interesting divergence between DJIndustrials future and SP500 future. Although the Santa rally was very strong, I could find Industrials weakening at the end. Together with some other technical factors signaled at the chart, it makes me believe the rally is due for a pullback.


Friday, December 25, 2009
Sox was right.... it was Santa rally
If you remember this post you will understand the title of the present post. We should have payed more attention to SOX , anyway it served us well to anticipate the possibility of EOY rally which was led by Techs and Small caps.
Here is an updated chart.

Here is an updated chart.

Wednesday, December 23, 2009
Monday, December 21, 2009
Bank coin 2
Finally our AH pattern worked out even farther than expected. Here is a pic I took earlier and forgot to post. As you know ES was propelled much higher but the good thing was we got positioned for the trade well in advance.


Sunday, December 20, 2009
Friday, December 18, 2009
BANK coin
Compare the chart from the preious post with the following one to wee how well this patter developed intraday.


Thursday, December 17, 2009
IBM update
Tuesday, December 15, 2009
IBM
IBM is forming a very interesting pattern across different time frames (ST, IT, LT). Many other stocks and indices have similar formations but I choose this one since is so clear and is such a representatative name.
I expect it to perform as a proxy for both Techs and overall stocks markets.
LT view IT -

Weekly view ST -

Daily view

Close up - Evening star pattern

I expect it to perform as a proxy for both Techs and overall stocks markets.
LT view IT -

Weekly view ST -

Daily view

Close up - Evening star pattern

Wednesday, December 09, 2009
Currencies and stock's bounce is probably done
We were signaling a bounce at currencies. It took place already and drove stocks higher in last session as expected. It filled ES gap but now we think market will resume the bearish trend.
In any case the less probable scenario will be a run up to 1128 ES area.

In any case the less probable scenario will be a run up to 1128 ES area.

Did you know that........ SOX just made year highs??
You know some techs stocks and subsectors tend to be leaders and anticipate moves for the broad market. Despite the recent drop in most indices, what SOX is doing called my attention. It may be driven by S rally today but in any case the formation is clear enough to keep an eye on it.
SPX-purple line
SOX- red-green line

SPX-purple line
SOX- red-green line

Tuesday, December 08, 2009
Some currencies aproaching a bouncing point
Wednesday, December 02, 2009
AUDUSD backtesting breaking point
As we were pointing out recently, AUDUSD was testing interesting trend lines, here is an updated version where we can see how the LT trend line(orange) rejected price and how IT trend line (white) was breached and then backtested confirming the ST-IT bearish case.
LT view

ST view:

LT view

ST view:

Tuesday, December 01, 2009
If we are so , so , so bullish, then why....?
If this market is as bullish as media tell us every day then why is being that hard to take out one simple level.....?

meanwhile.... there are some other levels that ARE being broken ....

Sometimes it is not necessary to ask a lady where she wishes to go, it is sufficient to know where she does not wish to go.

meanwhile.... there are some other levels that ARE being broken ....

Sometimes it is not necessary to ask a lady where she wishes to go, it is sufficient to know where she does not wish to go.
Subscribe to:
Posts (Atom)


