Friday, January 29, 2010

Weekend update

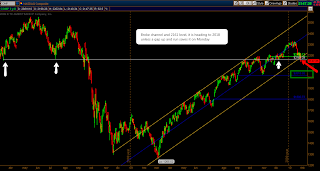
Well , 2 things happened , but as usual with Mrs market it happened in an unexpected way, the ES1067,5 level we were expecting after the bounce occured today before any meaningful bounce (although we did have a 23 ES points bounce today , but it was smaller than expected).

Now, the path looks more complicated because market needs to retest higher levels before more downside , so it may need to backtest ES1112-4 level from ES1069 which is a long ways. Anyway, it seems the most probable scenario

We will post updates of FTSE setup tomorrow to follow it up since we still believe is a valid indication of what other international indices will do in the short term.


Some charts as promised:

Overall view (ES)


Close up, daily view (ES)


DJ Trans (daily)


Nasdaq (daily)


SOX daily


Russell 2000 daily


OK, now one important guy that DID NOT break its channel, and might well be a clue

DJ Industrials daily


Get ready for a strong bounce in stock markets today- Spx 1118 is on the works - UPDATED

We are watching the FTSE for clues about next move on international indeces, including US. It seems to be bouncing off of IT bullish trendline which will propell a bounce to previous support (shorter grey line) if 5200 area is taken out. Under such conditions, expect SPX to test 1118 area or little higher.
GL


9:00 AM EST update

FTSE 100 got its level, now looking for more upside. International indices to follow up.

Monday, January 25, 2010

Sunday, January 24, 2010

Sum up - finished

Well finally I got enough time to re cap material and present an integrated view:

1- ES-SPX ANALYSIS : On 10-1 and 17-1 we ere posting these ES charts where you can see the range and the fake breakout that signaled a top and selloff was coming. Technically speaking it was a very weak breakout on no volume and no mkt internals support. We were a bit early when trying to spot the top (near ES1138) but despite of that, it was clear that the upside move was truncated from the beginning.

2- VIX analysis: Back on 12-26-09 we were anticipating this probable pattern which should lead to a strong bounce off of 19ish level . On 01-03-10, this update showed one more retest of low levels was to come before a real rally. In fact I got a little disappointed when some daily closes where below the 19 level but now we can see how it was just a typical fake break down (below the triangle's lower bound) just to shake traders out before the real move (up). Anyway if we take a look at monthly candles (original setup was monthly) we can see how the levels were respected.


3- EU indices:

We were also seeing some bearish setups at EU indices which lead us to think the same moves were about to happen on other stocks markets FTSE100, DAX and Eurostoxx50 anticipated the reversal a bit more clearly:
Also Greek markets were evidencing clear weakness specially at financial sector (before Obama statements)
Finally the definition was as evident for every one as previous signs were to anyone non perma bull biased


4-News events: As we said many times, the news themselves are not the cause of market moves. The fact that they coincide in time with moves is that they are used as excuses to trigger moves that were already prepared and "needed" by the market. So all the Obama and Bernanke issue , are interesting for the econo-political analysis but there is no a cause-effect relation with price itself. Why do we post them here then? Cause we need to be aware there is going to be a move (coincidence in time) when those events happen and trade accordingly. For example, if Bernanke gets confirmed , say on Monday, there is going to be a bounce in markets but is not caused by the news, it is already written in the charts .

5- ST outlook.
AT Friday's early session we were expecting a ST bounce from ES1101 to ES1114-8 area and a close near those levels. In fact it surprised me it was so weak but even less expected was the furious selloff late in the session. It completely blew VIX expected highs and ST tops as well as 1100 SPX level. Given this oversold condition we do expect a new bounce from ES1090 area to ES 1108.75-1111 area (see charts below).
Another foundation for the ST bounce move is the extreme values put/call ratios reached on Friday. As you can see below it touched BB 3 standard deviation. Similar past events are highlighted in green and drove to a ST bounce.


6- LT outlook:

The bullish trend is absolutely alive, in fact a pullback to SPX1134 area will be healthy for that trend

7- IT view.

  • Scenario 1 (most probable)

After a brief bounce to ES 1108.75- 1111 (12-31-08 LOW) I am expecting more downside to test
a) ES 1067 ("Dubai low")
b) ES 1031


  • Scenario 2 (less probable)

After a bounce to 1108.75-1111 area, some drop and then a rally into Fed day which continues to retest highs (probably ES1146 gap fill).

Saturday, January 23, 2010

(Real) market is back !

Statistically rare and technically clear though, this chart speaks for itself. Enjoy !

Friday, January 22, 2010

Get ready for a ST bounce - updated

Here is one of the technical reasons for a bounce today. Pretty clean and simple


All that glitters is not gold - then and now

Then: back on 01-19 we where signalign this set up at Eurostoxx 50 previewing sam behaviour across most internation indices:


Se it now and compare with any major internation inex, you will see they match perfectly


Now is time to consolidate this level so some shallow bounce and or range bound is expectable before the following move.

Thursday, January 21, 2010

GS WHISPER NUMBER IS 5,12 - match actual with that one to predict reactions

Greece leading the way down ?

While most EU indices are in green we are having important drops at Greece indicators. We think it may well lead EU down and consequently the rest of international markets.


See intraday stocks sectors performance for today:


Also the evolution of its CDS, thrilling......


Obama to Propose Limits on bank propietary trading


President Barack Obama is set to toughen his approach to Wall Street regulation on Thursday, announcing limits on the size of propietary trading operations in the second broadside against banks this month.

“The proposal will include size and complexity limits specifically on proprietary trading and the White House will work closely with [the House of Representatives] and Senate to work this into legislation moving on the Hill," an administrative official said.

See full story on NYT
http://www.nytimes.com/2010/01/21/business/21volcker.html?hp

Wednesday, January 20, 2010

All that glitters is not gold - updated

This why I posted recently that 1144 level on SPX is favourable for bears:
As we may see, EU is experimenting the efects of last bull's run excesses which are represented as a dangerous double top formation plus a sizable gap down. I sense bulls may be feeling very confident after they saved yesterday's dip so impressively, but that over confidence is the sign of their imminet failure ( ST wise) . I believe most international indices will perform as EUROSTOXX 50 below, keep an eye on it. You don't think is probable right?... well, we will see....


Update 11:48 EST

Now, the same chart will probably look different .... I am expecting some kind of bounce now but it won't last much.

Sunday, January 17, 2010

Sum up - under construction

Well, is time to sum up some of the previous posts in an integrated view in order to identify most probables scenarios to come.
Let's start with a classic:
(related previous posts)

Friday, January 15, 2010

Nailed 2 !

As expected Dax and Ftsee patterns (see here to compare charts) guided us throughout the opening, now reaching its targets some shallow bounce is probable here.

JPM earnings beat expectation but NOT WHISPER NUMBER (75 cents) so expect negative response

DAX pattern

This is very similar to the one on FTSE 100 which has turned too noisy today due to econ news. Therefore I am posting this one which may be the EU reference for US opening.


Tuesday, January 12, 2010

Interesting setup at FTSE 100 - Updated

EOD UPDATE:


I think they will buy this dip into the opening of US session at least for a while. Nevertheless this setup is interesting since FTSE 100 was among the strongest indices in EU....

Sunday, January 10, 2010

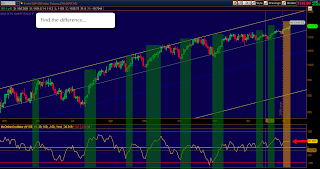
Find the difference....


We need to be careful with this pattern as a flat MCOS on rising price means an important move is being baked and it is not necessarily up.

Friday, January 08, 2010

If they can buy -85K non farms and 10% unemployment, thay can buy anything

and I mean anything....


So if you are not the kind of "close-your-eyes-and-press the buy button at every dip" trader you'd better stay away of this market. It is not that is being manipulated , as that always happened, it is something else, and it is ominous. I am not sure what it is but for sure this is not a technicals driven market, it has been a political driven market for many months (Time's man of the year was the king of pumping, not a business guru, so the economy hero was not a real wealth creator but just a Market Maker at best). Expect political events to be the turning points. Why do they need to pump this thing even without participation (no volume)? May be they need market (and consequently public opinion) support to the Obama Care stuff. If that is the case, we should wait till it's done to re evaluate markets.

-"Why dont you just shut up and follow the trend , which is up???".
Cause I don't break my trading rules which won't allow me to buy such a bad market (from a technical POV). I guess many other investors and traders are avoiding buying these prices too if the amazing lack of volume (especially on a break out) is of any guide. As a sum up, I don't want to be part of it, so I' ll be sidelined until this government requires less help from higher stock markets prices to survive or till is dead.


Just one more thing: nothing, absolutely nothing is for free in Economy nor is it at the markets so you can be 100% sure that all these excesses are going to be paid as 2003-2006 excesses were, I don't know exactly when but I know for sure who is going to pay them..... do you need an explanation for that....? Dig up a little in recent history....


Ps. Bulls may be really comfortable in this market, and it is the way to go short serm wise but don't forget 12-31-2009 session's last 30 mins steep selloff, that is part of the market too and is absolutely possible anytime.

Thursday, January 07, 2010

Insane

Yeah, yeah, divergences can last longer than you think, BUT there are limits.....


Absolutely shameful - No comments....

Wanna know some of the reasons for the banks rallies , read this


from Zeroedge:


Tim Geithner "Protects America From Itself" By Forcing Elimination Of Material AIG Disclosure


Might AIG Escape Prosecution for (Allegedly) Cooking the Books?

Wednesday, January 06, 2010

Bearish ST pattern on SPX

Yes , we believe this market is due for a correction. We know it has been said a zillion times during this incredible rally threfore we thought is better support our views with more varied and different findings. This is a ST pattern that I like particulary. Now is setting up again. If volume ever comes back to market then there is a high probability for it to work out soon.

Very dangerous high!!!

Be careful bulls !!!! it can reverse very easily


Bears: heads up, this may well be IT :)


Tuesday, January 05, 2010

Monday, January 04, 2010

Sunday, January 03, 2010

VIX pattern update

If you remember this post you can see below an updated chart. It shows both the support level and very likely the expansion cone patern are working out nicely. since VIX is close to fill a daily gap, we can expect to have some pullabck down before another leg up.


Friday, January 01, 2010